Jasper Alblas
Jasper Alblas
Data Engineering • Analytics • Business Intelligence
Welcome to this walkthrough of the Snort Room on TryHackMe.
In this room we will learn about the essentials of Snort. Snort is an open-source network intrusion detection and prevention system (IDS/IPS) that is used to monitor network traffic in real-time. It analyzes incoming data packets to detect potentially harmful activities, such as attacks, malware, or policy violations. Snort can be configured to log or block malicious activity based on predefined rules.
It operates by examining network traffic at different layers, from the data link to the application layer, and can identify patterns associated with known threats. Snort is widely used in cybersecurity for network defense, and it is highly customizable, allowing users to create their own detection rules or leverage existing ones.
Let’s learn how to use Snort to detect real-time threats, analyse recorded traffic files and identify anomalies.

Room URL:
https://tryhackme.com/r/room/snort
This room is part of the SOC Level 1 Path.
I am making these walkthroughs to keep myself motivated to learn cyber security, and ensure that I remember the knowledge gained by these challenges on HTB and THM.
Join me on learning cyber security. I will try and explain concepts as I go, to differentiate myself from other walkthroughs.
Now, let’s move on!
This room focuses on learning Snort, an open-source Network Intrusion Detection and Prevention System (NIDS/NIPS). It requires basic knowledge of Linux command-line navigation, network fundamentals (ports, protocols, and traffic), and traffic analysis.
Before starting, it’s recommended to complete the “Network Fundamentals” and “Linux Fundamentals” modules (1, 2, 3) if needed. Snort uses rule-based detection to identify malicious network activity, generating alerts based on defined rules.
Answer: No answer needed
Start up the machine attached to this task.
Once the machine had fully started, you will see a folder named Task-Exercises on the Desktop. Each exercise has an individual folder and files; use them accordingly to the questions.In this folder where are two subfolders:
The machine contains a script (traffic-generator.sh) which allows us to generate traffic to our snort interface. Once you run the script, it will ask you to choose the exercise type and then automatically open another terminal to show you the output of the selected action.
It is important to choose the correct exercise type when running the script so that the correct traffic data gets generated for each question. Also make sure to wait until the script execution is completed, unless you choose the wrong exercise.
Run the “traffic generator.sh” file by executing it as sudo.
sudo ./traffic-generator.shEasy peasy. Start up your terminal and move into the Task-Exercises folder by using cd, followed by running the script:
cd Desktop
cd Task-Exercises/
./easy.sh
Answer: Too Easy!
Before diving into Snort and analyzing traffic, let’s have a brief overview of what an Intrusion Detection System (IDS) and Intrusion Prevention System (IPS) is. It is possible to configure your network infrastructure and use both of them, but before starting to use any of them, let’s learn the differences.
This is a confusing question, a I expected it to the one of the modes just mentioned. But it refers back to the different systems discussed before that. Here they are referring to HIPS, as this is a host-based Intrusion Prevention System, which helps stop threat on a local machine.
Answer: HIPS
The question relates to Intrusion Detection System since it refers to detecting threats, but this time on a local network. So they answer is NIDS.
Answer: NIDS
Detecting threats (IDS) on a local machine (H), so HIDS is the answer.
Answer: HIDS
Stopping threats (IPS) on a local network (N), so the answer is NIPS.
Answer: NIPS
Behaviour-based Intrusion Prevention System (Network Behaviour Analysis – NBA) are very similar to NIPS.
Just like NIPS, the aim is to protect the traffic on the entire subnet and if a signature is identified, the connection is terminated. The difference to NIPS is that NBA uses behaviour-based systems monitor the traffic flow, and it needs to be trained.
Answer: NBA
The description is as follows.
“Snort can be deployed inline to stop these packets, as well. Snort has three primary uses: As a packet sniffer like tcpdump, as a packet logger — which is useful for network traffic debugging, or it can be used as a full-blown network intrusion prevention system. Snort can be downloaded and configured for personal and business use alike.”
Snort is described as a full-blown network intrusion prevention system.
Ugh..
Answer: full-blown
Behaviour based systems require a training period (also known as “baselining“) to learn the normal traffic and differentiate the malicious traffic and threats
Answer: baselining
This task briefly discusses how to verify that Snort is successfully installed and set up. Here is a summary:
snort -V helps confirm that Snort is installed and provides details about the installed version, including linked libraries like libpcap and PCRE.sudo snort -c /etc/snort/snort.conf -T to ensure the configuration file is correctly set up.Just run the following command:
snort -V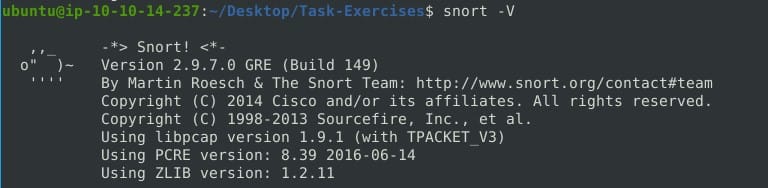
The build number is 149.
Answer: 149
Here we can run the other command we learned about:
sudo snort -c /etc/snort/snort.conf -TNearly at the end you will see the following info:

Answer: No answer needed
This time run:
sudo snort -c /etc/snort/snort.conf -T
Here there is only 1 snort rule read.
Answer: 1
Like tcpdump, Snort has various flags capable of viewing various data about the packet it is ingesting. Let’s cover the most essentials flag:
Ensure you run the traffic-generator script as sudo to generate sufficient ICMP/HTTP traffic:
sudo ./traffic-generatorEach mode provides progressively more detailed packet information.
Make sure to play around and try some of the different modes. Remember to run the generator script after turning on snort!
Answer: No answer needed
Snort can sniff and log packets using logger mode. This mode logs packets in a specified directory, allowing you to analyze traffic. Logs can be saved in binary (default) or ASCII format.
Key Parameters:
Logging with -l:
sudo snort -dev -l .Logging with -K ASCII:
sudo snort -dev -K ASCII -l .Reading Logs with -r:
sudo snort -r snort.log.<timestamp>Now, use the attached VM and navigate to the Task-Exercises/Exercise-Files/TASK-6 folder to answer the questions!
sudo snort -dev -K ASCII -l .sudo ./traffic-generator.shFirst of all, if you have problems opening the log file read the section about logfile ownership. Either change to the superuser:
sudo susudo chown username file or sudo chown username -R directoryTo answer the question about the source port we can actually look at the generated log files:

The file names like TCP:3009-53 in the Snort logs represent the protocol and the source/destination port numbers associated with the logged network traffic. Here’s the breakdown:
So the answer here is 3009.
Answer: 3009
snort -r snort.log.1640048004 -n 10You should see some general statistics, along with a list of the 10 packets. The final one looks like this:
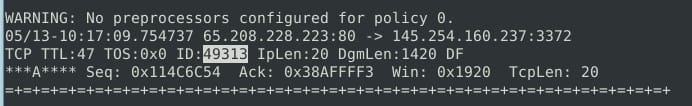
Here the IP ID is written: 49313.
Answer: 49313
This info is lacking if we run the previous command. We need to add the -X flag to display the entire packet, including headers and payload, in HEX and ASCII formats.
snort -r snort.log.1640048004 -n 10 -X
The referer is found nearly in the end.
Answer: http://www.ethereal.com/development.htm
We can see this info in the output from the previous question, but this time we look at the 8th packet:

Bonus info: the acknowledgement number field in the TCP header is used in TCP communication to indicate the next sequence number the sender of the acknowledgment expects to receive. It’s a crucial part of TCP’s reliable data transfer mechanism.
Answer: 0x38AFFFF3
We need to use BPF filters to help us here to quickly filter the traffic from the log to only include TCP traffic sent from or received on port 80.The command to run is:
snort -r snort.log.1640048004 tcp and port 80Remember to remove the earlier limit of packets (10). We need to filter on all the logged packets.
Answer: 41
Snort can operate in IDS/IPS mode to monitor and manage traffic based on user-defined rules. Here’s a breakdown of its key features and parameters:
sudo snort -c /etc/snort/snort.conf -T checks for configuration issues.sudo snort -c /etc/snort/snort.conf -D.ps and terminate with kill.The following rule triggers an alert for ICMP traffic:
alert icmp any any <> any any (msg: "ICMP Packet Found"; sid: 100001; rev:1;)This rule is located in /etc/snort/rules/local.rules.
sudo snort -c /etc/snort/snort.conf -A full -l .sudo ./traffic-generator.shFull disclosure: I was searching and searching and couldn’t find the right info. Then I realized that I needed to stop the Snort instance. First after stopping the IDS process will the output summary be visible. If you look around a bit you will find the following HTTP summary data:

Here it is clear that two HTTP Get requests took place in the traffic generated by the traffic-generator script.
Answer: 2
I highly recommend you to play a bit around with the parameters discussed in the task. Take your time, I’m not going anyway!
Answer: No answer needed
Snort’s capabilities go beyond sniffing, logging, and detecting/preventing threats. Its PCAP read/investigate mode allows you to work with PCAP files effectively. After processing a PCAP file with Snort, you’ll receive default traffic statistics and alerts based on your ruleset.Simply reading a PCAP without any additional parameters will only provide an overview of the packets and basic statistics. However, this isn’t particularly useful in most cases. By investigating the PCAP with Snort, you can take advantage of its rules to speed up the investigation process by detecting known threat patterns.PCAP mode parameters are explained below:
This allows you to read and analyze a single PCAP file. For example, running sudo snort -r icmp-test.pcap would load and analyze the packets in icmp-test.pcap.
sudo snort -c /etc/snort/snort.conf -q -r icmp-test.pcap -A console -n 10This command analyzes the icmp-test.pcap file using Snort’s configuration, producing alerts based on the ruleset. The -A console flag outputs alerts to the console, and -n 10 limits the number of packets processed.
This allows you to provide a space-separated list of PCAP files for Snort to process multiple files simultaneously. Snort will analyze both files using the same configuration.
sudo snort -c /etc/snort/snort.conf -q --pcap-list="icmp-test.pcap http2.pcap" -A console -n 10This command processes both icmp-test.pcap and http2.pcap files but outputs combined alerts without distinguishing between the two files.–pcap-showThis parameter shows the name of each PCAP as it is being processed. It’s useful when you’re working with multiple files and need to differentiate which alerts correspond to which file.
sudo snort -c /etc/snort/snort.conf -q --pcap-list="icmp-test.pcap http2.pcap" -A console --pcap-showsudo snort -c /etc/snort/snort.conf -A full -l . -r mx-1.pcapEnter the command above. Among the output you will see the following section:

The number of alert is 170.
Answer: 170
Scroll a bit down and you can find the answer:

The number of stream segments is 18.
Answer: 18
Even more done you can see HTTP info. Among other data, we can see that the number of HTTP response headers extracted is 3.

Answer: 3
sudo snort -c /etc/snort/snortv2.conf -A full -l . -r mx-1.pcapRun snort on the same file, but now with config file snortv2.conf.
This time the answer is 68:

Answer: No answer needed
sudo snort -c /etc/snort/snort.conf -A full -l . -r mx-2.pcapRun the above command. You get the idea now:

The answer is 340 here.
Answer: 340
Look at the output again. The number of detected TCP packets is 82:

Answer: 82
Well, they are really making this easy with giving us the right command. You know the drill. You can find the number of alerts here:
sudo snort -c /etc/snort/snort.conf -A full -l . --pcap-list="mx-2.pcap mx-3.pcap"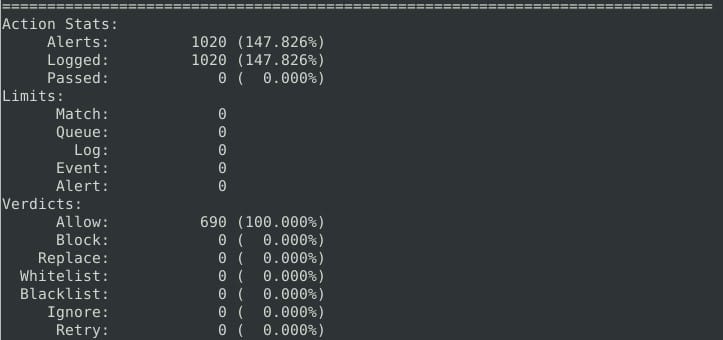
The number is 1020.
Answer: 1020.
Understanding Snort rule format is critical for blue and purple teamers, especially in IDS/IPS contexts. Snort operates in passive mode by default (IDS) and requires inline mode for IPS functionality. The structure of a Snort rule includes action, protocol, source/destination IPs, ports, and optional rule options.
The following image from TryHackMe is really great:

1:1024), or exclude (!21).Efficient rule creation requires understanding Snort’s options, focusing on use cases, and constant revision for optimal performance. Rules are saved in local.rules (e.g., /etc/snort/rules/local.rules). This is where we should add additions in this task.
Before running the mentioned snort command we need to insert our rule into the /etc/snort/rules/local.rules file. The only rule option we have to filter on is the IP ID, which is part of the non-payload options. This can be added by adding (id:35369;) to the end of our rule. The only thing lacking is the type of Protocol to filter one. This is not mentioned, but we can just filter on the four protocols supported by Snort2, one at a time (IP/TCP/UDP/ICMP). Finally, each rule needs a sid, and user created rules should a sid higher than 1.000.000.
I suggest we write the rule as follows:
alert icmp any any <> any any (id:35369;sid:1000001)Make sure you are in the Exercises/Exercise-Files/TASK-9 folder. To edit the file you can use the following command:
sudo gedit local.rulesIt should look like this:

Save it, and run the snort command:
snort -c local.rules -A full -l . -r task9.pcapIt should say one alert:

Now, Snort should have created a log file:

The request name is TIMESTAMP REQUEST.
Answer: TIMESTAMP REQUEST
Edit the local.rules file again. This time we will add the following rule:
alert tcp any any <> any any (flags:S;sid:1000002)Packets with the SYN (S) flag set should by definition be TCP (remember the 3-way handshake?). Your rule file should look like this:

Read the output summary to get the answer:

Answer: 1
I did not know what a Push-Ack flag was, so I ended up reading about them. In essence these flags mean the following:
We can use a similar rule as before:
alert tcp any any <> any any (flags:PA;sid:1000003)Add it to the rule file and run Snort again. You know the drill now.

The number of package alert is 216.
Answer: 216
To create a Snort rule that filters packets with the same source IP and destination IP, you can use the ip protocol and a check for the source IP matching the destination IP using the sameip keyword.
The rule should look like this:
alert ip any any -> any any (sameip; sid:1000004;)I received 13 alert, but this is not the right answer. The hint mentions:
Review the logs and count the number of the alerts. Don’t consider the unassigned IP addresses, IP requests and broadcast/multicast messages.
After some research I found out the rule needs to be expanded to take the following into consideration:
By manually going through the log and by ignoring log entries from broadcast & multicast traffic, and traffic originating from unassigned IP addresses I counted to 7. These are the log entries worth counting:
[**] [1:1000004:0] [**][Priority: 0]12/18-21:57:47.100000 192.168.0.1:0 -> 192.168.0.1:0TCP TTL:64 TOS:0x0 ID:0 IpLen:20 DgmLen:46 DF******** Seq: 0x0 Ack: 0x0 Win: 0xFFFC TcpLen: 20
[**] [1:1000004:0] [**][Priority: 0]12/18-21:57:47.200000 192.168.0.21:0 -> 192.168.0.21:0UDP TTL:64 TOS:0x0 ID:0 IpLen:20 DgmLen:46 DFLen: 18
[**] [1:1000004:0] [**][Priority: 0]12/18-21:57:47.300000 192.168.0.44:4444 -> 192.168.0.44:4444UDP TTL:64 TOS:0x0 ID:0 IpLen:20 DgmLen:46 DFLen: 18
[**] [1:1000004:0] [**][Priority: 0]12/18-21:57:47.400000 192.168.0.21:0 -> 192.168.0.21:0UDP TTL:64 TOS:0x0 ID:0 IpLen:20 DgmLen:46 DFLen: 18
[**] [1:1000004:0] [**][Priority: 0]12/18-21:57:47.500000 192.168.0.21:0 -> 192.168.0.21:0UDP TTL:64 TOS:0x0 ID:0 IpLen:20 DgmLen:46 DFLen: 18
[**] [1:1000004:0] [**][Priority: 0]12/18-21:57:47.600000 192.168.0.11:4444 -> 192.168.0.11:4444TCP TTL:64 TOS:0x0 ID:0 IpLen:20 DgmLen:46 DF******** Seq: 0x0 Ack: 0x0 Win: 0xFFFC TcpLen: 20
[**] [1:1000004:0] [**][Priority: 0]12/18-21:57:47.700000 192.168.0.11:0 -> 192.168.0.11:0TCP TTL:64 TOS:0x0 ID:0 IpLen:20 DgmLen:46 DF******** Seq: 0x0 Ack: 0x0 Win: 0xFFFC TcpLen: 20
Answer: 7
When an analyst modifies an existing Snort rule successfully, they must update the rev(revision number) field in the rule. This field tracks changes to the rule and ensures proper version control. The rev field allows other analysts to know that the rule has been modified and ensures that Snort uses the correct version of the rule. It also helps in troubleshooting by identifying which revision of the rule is causing alerts.
Answer: rev
This task is very theory heavy. The main points are as follows:
Enable IPS mode using the afpacket module:
Common DAQ modules:
Define logging and alerting formats for better efficiency.
Answer: No answer needed
In this room, we covered Snort, what it is, how it operates, and how to create and use the rules to investigate threats.
Answer: No answer needed

Congratulations on finishing this walkthrough of the TryHackMe Snort room. I thought this room had a great balance between theory and practice, and I personally can’t wait to practice our skills during the next two Snort rooms. Coming up: Snort Challenge: The Basics.
I hope you enjoyed this walkthrough. Come back soon for more walkthroughs of rooms on TryHackMe and HackTheBox, and other Cybersecurity discussions.
Read more of my walkthroughs here.
You are welcome to comment on this post, or share my post with friends.
I would be even more grateful if you support me by buying me a cup of coffee:

I learned a lot through HackTheBox’s Academy. If you want to sign up, you can get extra cubes, and support me in the process, if you use the following link: