Jasper Alblas
Jasper Alblas
Mastering Data & Cybersec
Welcome back to part 2 of this data fundamentals series. You can find part 1 here.
When I first started working with data, I remember being surprised at how dirty most data was. You might have learned about how organized everything is supposed to be. In reality, a lot of the data that powers reports, apps, and dashboards does not neatly in databases, waiting to be queried and modeled. Instead, spreadsheets and mysterious systems are spitting out numbers, and things might seem much more chaotic.
But hey! This is where data engineers come in. Understanding how to structure our data in a better way helps you with everything you’ll do as a data analyst, engineer, or BI developer. We need to understand how data is structured, stored, and linked together. And why we store data in different ways, depending on its use case.
Before diving into databases, let’s clear up one of the first big distinctions you’ll encounter: structured vs. unstructured data.
Most BI tools (Power BI, Tableau, Qlik) are optimized for structured data. Knowing the difference helps you choose the right approach for cleaning and analyzing your data. Let’s go a bit more into details.
Structured data is organized in rows and columns — like a spreadsheet.
Each column has a defined type (text, number, date), and every row represents a single observation or record.
Examples include:
Structured data is predictable, consistent, and easy to query with SQL. This is the data you’ll model into facts and dimensions, clean with transformations, and visualize in dashboards.
Unstructured data, on the other hand, doesn’t fit into neat rows and columns. It’s messy — flexible, but hard to standardise.
Examples include:
These data types require different tools (like data lakes, search indexes, or machine learning models) to make sense of.
💡 In practice, companies often work with both. For example, structured customer data from a CRM might be enriched with unstructured support ticket text from an email system — combining them gives richer insights.
Most of your structured data will live in something called a database — a digital system for storing, organizing, and retrieving information efficiently.
Think of a database as a highly organized digital filing cabinet. Inside it are tables, which store data about specific subjects, like Customers, Orders, or Products.
Inside each database:
Example:
| Customers | ||
|---|---|---|
| CustomerID | Name | Country |
| 1 | Alice | Denmark |
| 2 | Bob | Germany |
| Orders | |||
|---|---|---|---|
| OrderID | CustomerID | Date | Amount |
| 1001 | 1 | 2023-01-01 | 59.99 |
| 1002 | 2 | 2023-01-03 | 120.50 |
Notice that CustomerID appears in both tables.
This relationship allows us to answer questions like:
Relational databases (like PostgreSQL, SQL Server, or MySQL) are built around these relationships — which is why we call them relational.
Keys and relationships are one of the most important elements of data fundamentals out there.
Relationships are the backbone of your data model. Without them, your reports won’t know how to connect the dots.
Once you understand these building blocks, everything else — from SQL joins to Power BI models — starts to click into place.
As datasets grow, it’s not enough to just have tables — they need structure. That’s where schemas come in.
A schema defines how tables connect and what each one represents.
For example:
DimCustomer → stores descriptive info about customers (name, region, segment).DimProduct → stores details about products (name, category, price).FactSales → stores actual transactions (sales amount, quantity, date).Together, these form a star schema, one of the most common and efficient ways to model data for analytics.
💡 At this stage, you don’t need to master all schema types — just know that good structure is what turns raw data into something reliable, fast, and reusable.
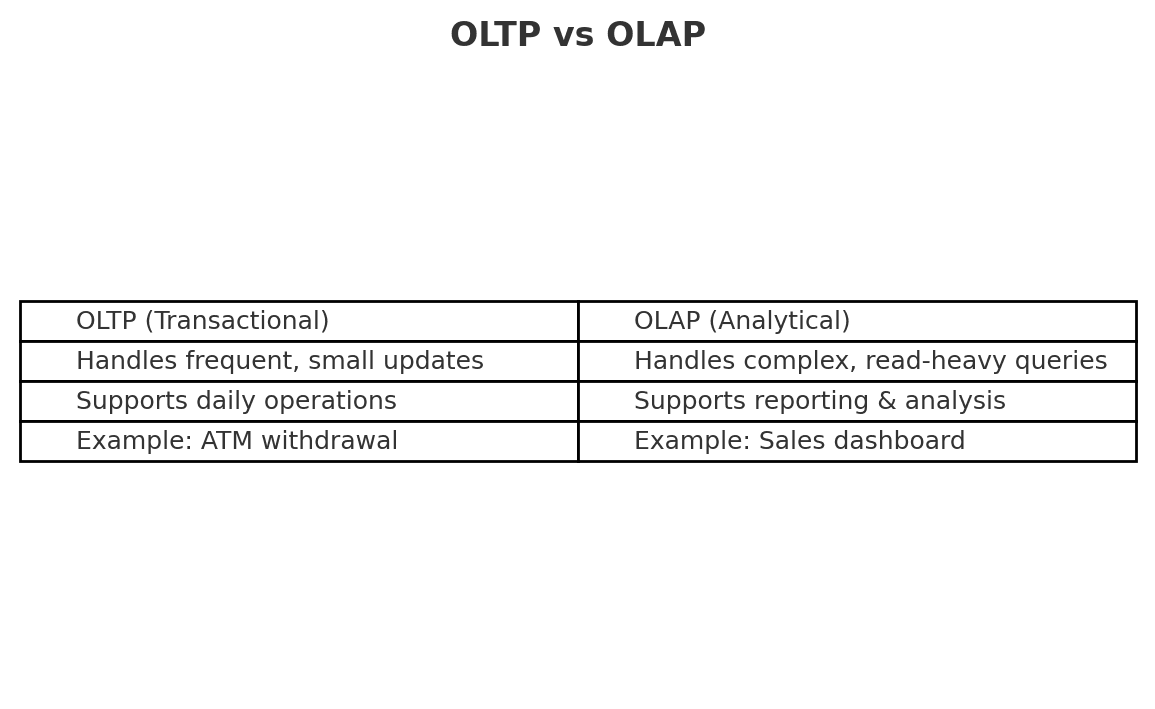
Historically, there are two type of data models: OLTP and OLAP. Which one is best depends on your use case. Usually, most of the data you consume comes in OLTP form. Let’s discuss the difference:
OLTP is for doing business. OLAP is for understanding it. BI tools like Power BI sit firmly in the OLAP world.
In traditional database design, normalization is the process of organizing data to reduce redundancy and improve integrity. It breaks data into smaller related tables — for example, separating customer details from orders.
While normalization is great for transactional systems (OLTP), analytical systems (OLAP) often benefit from denormalized structures like star schemas. We’ll explore that trade-off in more detail later in the series.
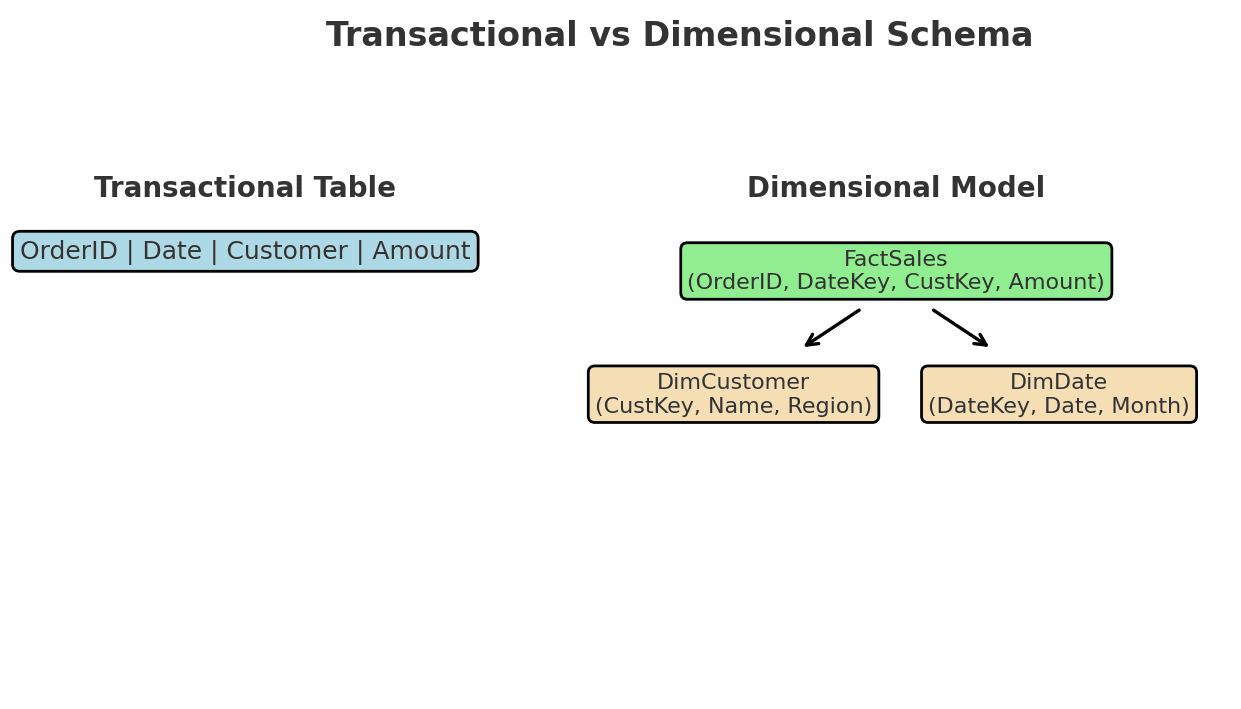
Dimensional modeling helps you build scalable, reliable reports. It’s the difference between chaos and clarity. We will explore these concepts much more in another part.
Granularity is the “zoom level” of your data:
Choosing the right granularity affects performance, accuracy, and how your reports behave over time.
Well-modeled, structured data:
When I first worked on a production data model, I realized how crucial this was. A single missing key or inconsistent type could cascade into dozens of broken dashboards. The beauty of structured data is that it keeps the chaos in check.
Take a dataset you know — for example, an e-commerce site or your company’s sales data.
This exercise helps you think like a data engineer — not just looking at numbers, but at how data relates.
This was the warm-up. You now know the landscape: roles, data flows, and key concepts.
In the next article, you’ll load your first dataset (Superstore), explore it in Power BI, and start recognizing which columns are facts and which are dimensions. If you want to follow along hands-on, make sure you’ve got Power BI Desktop installed.
As we move forward, you’ll gradually step into the shoes of a data engineer — learning how data gets extracted, cleaned, stored, and modeled for analytics.
You are welcome to comment on this post, or share my post with friends.I would be even more grateful if you support me by buying me a cup of coffee:


[…] You can find part 2 here. […]