Jasper Alblas
Jasper Alblas
Data Engineering • Analytics • Business Intelligence
You’re on Part 0.1 of 5 in Foundations → the hands-on build (QuakeFlow) starts at Part 1.1
What is data engineering, in one sentence? It’s the practice of moving data from the messy, fast-changing systems a business runs on into a separate, structured form that people can safely analyze — without the two ever getting tangled up.
Most of the confusion beginners have about data engineering starts right here — with tools like Python, SQL, and cloud platforms getting introduced before anyone explains the actual problem those tools exist to solve. This article is that missing piece: the world data engineering operates in, before any of the tooling.
The focus here is the mechanics — how data actually moves, and how we discuss the world of data as a data engineer. What the day-to-day work looks like, and whether it’s a career worth pursuing, is what 0.2 and 0.3 are for.
Every operational system is built to do one specific job, fast and reliably, one event at a time. Think of a network of seismic monitoring stations: the instant a sensor detects strong ground motion, that reading needs to be logged and evaluated in milliseconds, because it might trigger an earthquake early warning. This kind of system has a name — OLTP, short for Online Transaction Processing. Speed and reliability, one record at a time, is the entire point.
Now imagine a seismologist wants to ask a very different kind of question: “How has earthquake frequency in this region changed over the last twenty years, broken down by depth and magnitude?” That question doesn’t touch one reading — it touches millions of them, scanned, grouped, and compared across decades.
Run that kind of historical analysis against the same live system responsible for real-time alerting, and you have a serious problem. The system has to scan huge volumes of historical data while also trying to process incoming readings that might need to trigger a warning right now. In the best case, the alert is delayed by seconds. In a life-safety system, that’s not a rounding error — that’s the entire reason the two workloads need to live in separate systems.
This is why a second kind of system exists — one built specifically to answer big analytical questions without threatening the system the business actually runs on. This is called OLAP, Online Analytical Processing.
Data engineering is the discipline that exists in the gap between these two systems — safely, reliably, and repeatably moving data from OLTP into OLAP, so that neither one has to compromise on what it’s good at.
Data doesn’t teleport from an operational system into a dashboard. It moves through a lifecycle, and understanding each stage is what lets you reason about any data problem you’ll ever encounter, regardless of which specific tools are involved.
Ingestion — Data is pulled or pushed out of the source system. This could be a nightly export, an API call, or a live stream of events.
Storage — The raw data lands somewhere durable before anything is done to it. This “raw zone” matters more than beginners expect — if a downstream step breaks, you need an untouched copy to fall back to.
Transformation — Raw data is cleaned, reshaped, and combined. Missing values get handled. Types get corrected. Multiple sources get joined into something coherent.
Modeling — The transformed data is organized into a structure built specifically for answering business questions — the beginnings of what you’ll later know as dimensional modeling, star schemas, and fact/dimension tables.
Serving — The modeled data is made available to whoever needs it: a BI dashboard, an analyst running SQL, a machine learning pipeline, or another application entirely.
Consumption — The actual moment of value: a decision gets made, a report gets read, a recommendation gets shown to a customer.
Data engineers typically own the middle of this chain — ingestion through serving. Notice what’s not in that ownership: the actual insight. That’s the job of analysts and data scientists. Data engineers build and maintain the infrastructure that makes their work possible; they generally don’t make the final call on what the data means.
Here is a more graphical way of showing the flow:
The tools may change from company to company, but the lifecycle is usually the same: data is created, collected, stored, cleaned, modelled, served, and finally used.
Data engineering exists because operational systems and analytical systems have different purposes. A seismic monitoring network, a hospital system, a banking platform, or a logistics system is built to run real processes in real time. A reporting platform is built to analyse performance and patterns after the fact. Trying to use the same system for both usually creates problems — and at best, it quietly degrades performance for everyone.
This is why organisations separate operational workloads from analytical workloads. Data engineers build the bridge between the two — moving data from systems that run operations into systems that help understand them.
One of the most important distinctions in the data world is the difference between OLTP and OLAP. These terms look technical, but the idea is simple. Let’s cover them properly.
OLTP stands for **Online Transaction Processing**.
OLTP systems handle real-time operational activity. Examples:
– A seismic sensor logs a ground-motion reading
– An early-warning alert is triggered
– A monitoring station’s status is updated
– A sensor calibration record is created
– A field technician account is created
OLTP systems are optimised for fast inserts and updates, many small transactions, data consistency, and real-time operations.
Examples of OLTP databases: SQL Server, PostgreSQL, MySQL, Oracle.
A typical OLTP question: *Did this station just detect a reading above the alert threshold?*
OLAP stands for **Online Analytical Processing**.
OLAP systems are used for analysis and reporting. Examples:
– Total earthquakes by month
– Average magnitude by region
– Frequency trends by depth
– Year-over-year change in seismic activity
– Station reliability over time
OLAP systems are optimised for large queries spanning many data areas (joins), aggregations, historical analysis, and reporting.
Examples of OLAP platforms: Snowflake, Azure Synapse, BigQuery, Redshift, SQL Server Analysis Services, Power BI semantic models.
A typical OLAP question: *How did earthquake frequency in this region change over the last twelve months?*
The difference between OLTP and OLAP explains why data platforms exist. Operational systems are good at recording events. Analytical systems are good at understanding patterns. Data engineering connects the two:
OLTP System
Runs the business
↓
Data Pipeline
Moves and prepares data
↓
OLAP System
Analyses the business
Once you understand this, many data tools become easier to place. Python may be used to extract and load data. SQL may be used to transform and query data. dbt may be used to organise transformation logic. Airflow may be used to schedule pipelines. Power BI may be used to present the final data. Each tool plays a role in the same overall flow.
Let’s look more closely at the lifecycle data usually follows: Generation → Ingestion → Storage → Transformation → Modeling → Serving → Consumption.
Generation is where data is created. Examples: a seismic sensor records a ground-motion measurement, a station logs a status update, a technician updates a maintenance record, a system writes a log entry.
At this stage, the data belongs to the source system — an application database, an API, a file, a queue, or a third-party platform. Data starts in systems designed for a specific operational purpose, and that purpose is usually not analytics.
Ingestion is the process of collecting data from source systems and bringing it into the data platform:
> Seismic Network / Station API / Sensor Logs → Ingestion Layer
Batch ingestion collects data at scheduled intervals — every night, every hour, every 15 minutes. This is common for reporting.
Real-time ingestion collects data as events happen — early-warning triggers, live sensor streams, continuous monitoring feeds. It’s powerful but more complex.
Most beginner data engineering work starts with batch ingestion because it is easier to understand and is widely used in analytics — which is exactly where this series’ hands-on project, QuakeFlow, begins.
Once data has been ingested, it needs somewhere to live.
Databases — used for structured data in rows and columns. Examples: SQL Server, PostgreSQL, MySQL.
Data lakes — used for storing raw data files at scale. File types: CSV, JSON, Parquet, Avro.
Data warehouses — used for structured analytical data. Examples: Snowflake, BigQuery, Redshift, Azure Synapse.
In many modern platforms, data first lands in a raw area and is then transformed into cleaner, more structured layers:
> Raw Data → Cleaned Data → Modelled Data
This pattern will matter later in the hands-on part of this series. An example of this pattern is the medallion architecture, which is quite common.
Raw data is often messy: missing values, duplicate records, invalid dates, inconsistent naming, mismatched units, incorrect data types, broken relationships between tables.
Transformation is the process of cleaning, standardising, and enriching data. For example, a raw event date might arrive as `03/04/26` but get standardised to `2026-04-03`. A station name might contain extra spaces. A region label might need mapping to a standard naming convention. A seismic reading may need to be joined with station and region metadata.
Transformation turns raw data into trusted data.
Clean data is not always easy to analyse. Modeling is the process of organising data so that analysts and reporting tools can work with it effectively — most commonly through dimensional modeling.
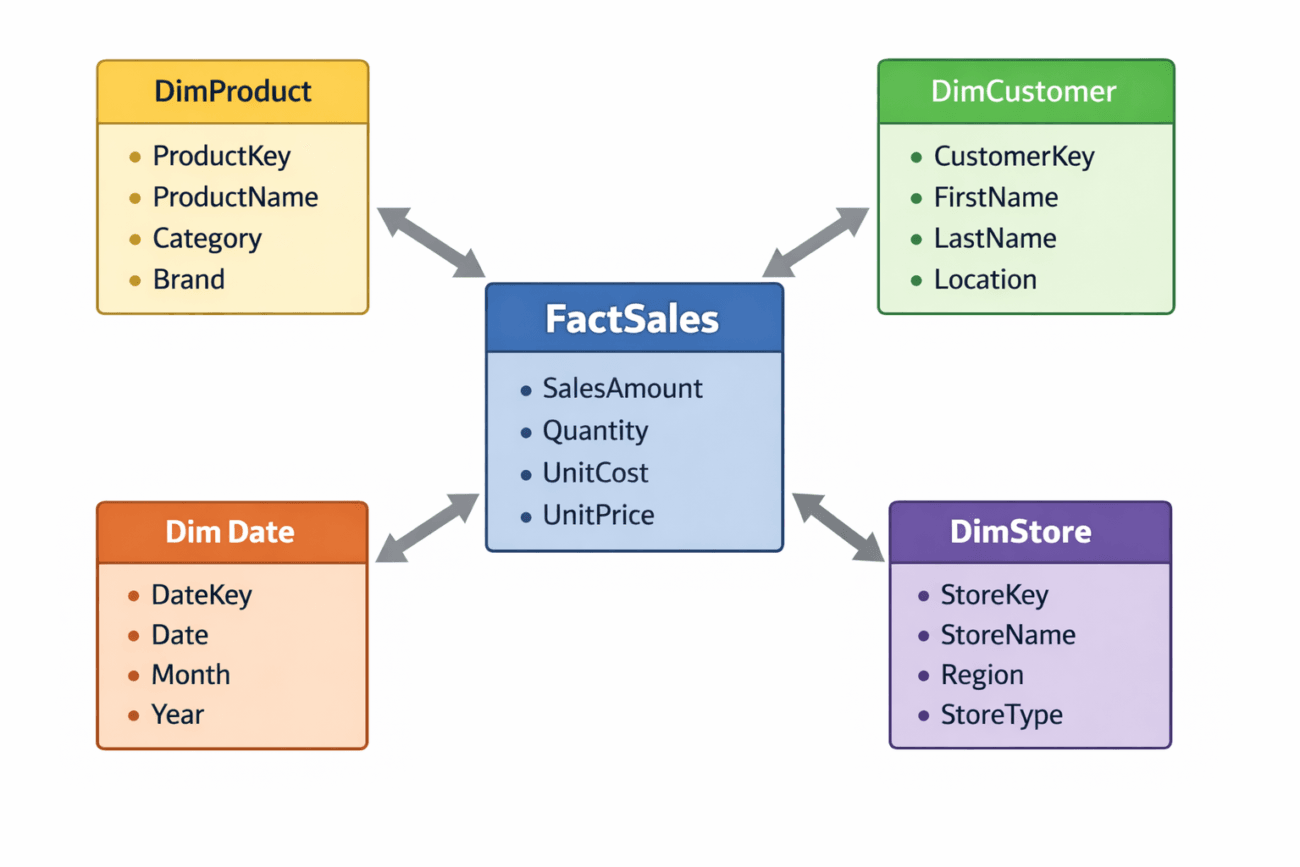
A simple earthquake model has a fact table containing measurable events (earthquake readings) and dimension tables describing those events (station, region, date). This structure makes analytical questions easier to answer: earthquakes by region, by month, by station, by depth band. Later in this series, you will build exactly this kind of model yourself.
Here is a way of showing a more standard BI model:
Serving means making data available to the people and systems that need it: Power BI dashboards, analysts writing SQL, data science notebooks, APIs, machine learning pipelines, other applications.
The goal is not just to store data — the goal is to make it usable. That’s where value actually gets created.
Consumption is the final stage: someone or something uses the data. A seismologist reviews a dashboard. An emergency planning team checks regional trends. A researcher trains a model estimating aftershock likelihood. A decision-maker allocates monitoring resources.
If nobody uses the data, the pipeline doesn’t matter. The entire platform exists to support better decisions and better systems.
Data doesn’t always arrive in the same shape, and understanding the differences helps explain why different tools and techniques exist.
**Structured data** is organised into rows and columns:
| EarthquakeID | StationID | RegionID | Magnitude |
| 70001 | 401 | 12 | 5.6 |
| 70002 | 402 | 8 | 4.2 |This is common in relational databases and data warehouses, usually queried with SQL. Most beginner data engineering work starts here.
**Semi-structured data** has some organisation but doesn’t fit neatly into rows and columns — a common example is JSON, exactly the shape a real earthquake API returns:
{
  "id": "us7000abcd",
  "properties": {
    "mag": 5.6,
    "place": "Banda Sea"
  }
}Semi-structured data is common with APIs, web events, application logs, and message queues. Data engineers often need to flatten or parse it before it’s usable in reporting — exactly what you’ll do with QuakeFlow’s real API data later in this series.
**Unstructured data** has no predefined table-like structure: raw seismograph waveform files, satellite imagery, free-text incident reports. It can still be valuable but usually requires specialised processing.
For beginner data engineering, structured and semi-structured data are the best places to start — and that’s also where this hands-on series begins.
Another important distinction is how quickly data needs to move.
**Batch processing** collects and processes data at scheduled intervals — every night, every hour, every Monday morning. It’s common for regional activity reports, station reliability dashboards, and periodic trend analysis. Advantages: simpler to build, easier to debug, more cost-effective, and sufficient for most analytical needs. Most of the hands-on work early in this series uses batch processing, intentionally — it teaches the fundamentals clearly.
**Real-time processing** handles data almost immediately as events occur — early-warning alerting, live monitoring dashboards, streaming sensor feeds. Powerful, but it introduces more complexity, different architecture, and stronger operational discipline. As a beginner, understand batch first; real-time becomes far easier to reason about once batch makes sense.
This article isn’t primarily about careers — that comes next — but it helps to briefly understand who works with data.
Data Engineer — Builds the pipelines, storage layers, and infrastructure that move and prepare data.
Analytics Engineer — Transforms raw data into clean, tested, business-friendly models, often using SQL and dbt.
Data Analyst — Uses data to answer questions and communicate insights.
BI Developer — Builds semantic models, dashboards, and reporting solutions, often in tools like Power BI.
Data Scientist — Uses statistics and machine learning to build predictive models and experiments.
A simple way to think about it: the Data Engineer builds the foundation, the Analytics Engineer shapes the data, the BI Developer builds reporting models, the Data Analyst finds and explains insights, and the Data Scientist builds predictive models.
In smaller teams, one person may cover several of these. In larger companies, they’re often separate teams entirely. The next article covers this in much more detail.
This article is the first step in a broader hands-on learning path. The goal isn’t just to explain data engineering — it’s to help you build something real.
The first five articles are Foundations. They prepare you before the hands-on project begins. From Part 1.1 onward, the series becomes hands-on: you’ll build a project step by step, following the exact lifecycle introduced in this article. That’s why the lifecycle matters here — it isn’t just theory, it becomes the actual structure of the project.
Throughout this series’ hands-on phase, you’ll build a real pipeline called **QuakeFlow**, working with live earthquake data from the USGS catalog — not a fictional company, real seismic events.
Like any real data source, it comes with genuine data about:
– Individual earthquake events (location, depth, magnitude, timing)
– Monitoring stations and their metadata
– Regions and geographic groupings
– Data quality issues you’ll need to actually handle, not simulate
Your job throughout this series is to turn that raw feed into a usable analytics solution — the exact same lifecycle covered above, applied to a real, occasionally messy, genuinely interesting dataset.
## Why We Start With Foundations
It’s tempting to skip straight to the code, but the foundations matter.
When you later write a Python ingestion script, you’ll know which part of the lifecycle you’re working in. When you design database tables, you’ll understand why modelling matters. When you build a Power BI dashboard, you’ll understand what serving and consumption actually mean. And when something breaks — because it will — you’ll be able to locate exactly where in the pipeline the problem belongs.
That’s the difference between copying tutorials and actually understanding data engineering.
Whenever you encounter a new data tool, ask: What problem does this tool solve? Where does it fit in the lifecycle? Who uses the output? What happens if it fails?
Python — often used for ingestion, automation, and data processing.
SQL — used for querying, transforming, and modelling structured data.
dbt — used for managing SQL transformations in a structured, testable way.
Airflow — used for scheduling and orchestrating pipelines.
Power BI — used for modelling, visualising, and consuming data.
Tool names will change over time. The lifecycle stays mostly the same. That’s why learning the model first is so valuable.
– Data becomes valuable when it moves from raw information to usable insight
– Operational (OLTP) systems run real-time processes; analytical (OLAP) systems help understand patterns
– Data engineering connects the two
– Most data work follows a lifecycle: ingestion, storage, transformation, modeling, serving, consumption
– Batch processing is the best place for beginners to start
– The hands-on QuakeFlow project follows this exact same lifecycle
In Part 0.2, we look at the main careers in data in more detail — Data Engineer, Analytics Engineer, Data Analyst, BI Developer, Data Scientist — what each role does, how they work together, and how to start thinking about which path fits you.
After that, we narrow back to data engineering specifically and prepare you for the hands-on part of the series.
First, understand the world. Then, understand the roles. Then, start building.
Is data engineering still a good career with AI taking over?
More stable than most. Every AI system requires reliable data pipelines to train and operate. Companies investing in AI are simultaneously investing heavily in data infrastructure. Data engineering roles show high demand with stable jobs even during layoffs, as core data teams tend to be protected.
Do I need to know machine learning to be a data engineer?
No. Data engineers support machine learning teams but aren’t responsible for building models. You need to understand the interface — what a feature store is, how training data pipelines work — but you don’t need to be a data scientist.
What programming languages do I need?
Python and SQL are the two non-negotiables. Python for pipeline logic, SQL for querying and modeling. This series teaches both — Python starting directly in the QuakeFlow build (Part 1.1), and SQL once we load data into a real database in Part 1.4.
Can I become a data engineer without a maths background?
Yes. Data engineering is much closer to software engineering than to statistics or machine learning. Heavy mathematics isn’t required — logic, systems thinking, and programming are the core skills.
How is the work-life balance?
Generally good at most companies — often better than software engineering roles shipping consumer products on aggressive release cycles. On-call can disrupt evenings occasionally, but mature data teams invest in monitoring and runbooks specifically to minimise this.
Do I need a computer science degree to become a data engineer?
No. Demonstrable skills, project experience, and a structured learning path matter more to most employers than a specific degree. This series is designed to be self-contained.
What’s the difference between a data engineer and a software engineer?
Significant overlap in tools (Python, Git, testing, systems thinking) but different domain focus. Data engineers specialise in data infrastructure — pipelines, storage, modeling — rather than user-facing applications. Many data engineers come from software engineering backgrounds.
How long does it take to become job-ready as a data engineer?
With consistent study and hands-on project work, most people with basic programming familiarity can reach entry-level capability in 6–12 months. This series is structured to get you there systematically.
Is data engineering a stable career with AI becoming more prevalent?
More stable than most. AI models require clean, reliable data pipelines to train and operate. Every AI initiative a company runs increases demand for data engineers, not decreases it. The judgment, architecture, and governance work data engineers do is precisely what AI tools can’t replace.
*Next up → [Part 0.2: Data Careers Explained](https://www.jalblas.com/blog/data-careers-explained/) — now that you understand how data moves, let’s look at who actually moves it.*



[…] How the Data World Works […]
[…] How the Data World Works […]
[…] How the Data World Works […]
[…] How the Data World Works […]