TryHackMe: Introduction to SIEM Walkthrough (SOC Level 1)

Welcome to this walkthrough of the Introduction to SIEM Room on TryHackMe. If you have been following along with the SOC Level 1 Path, you have just finished learning about EDR, great job! Now it is time to learn about SIEMs, Security Information and Event Management systems.

Introduction to SIEM Banner

Room URL:
https://tryhackme.com/room/introtosiem

I am making these walkthroughs to keep myself motivated to learn cyber security, and ensure that I remember the knowledge gained by these challenges on HTB and THM. Join me on learning cyber security. I will try and explain concepts as I go, to differentiate myself from other walkthroughs.

Now, let’s move on! This is going to be a long one!


Task 1: Introduction

SIEM stands for Security Information and Event Management system. It is a tool that collects data from various endpoints/network devices across the network, stores them at a centralized place, and performs correlation on them.In this room, we will learn how different devices in a network generate logs and why it’s essential to have a centralized solution to collect, normalize, and correlate these logs.  

Learning Objectives

  • Understand the different types of log sources
  • Identify the limitations of working with isolated logs
  • Recognize the importance of a SIEM solution
  • Explore the features of a SIEM solution
  • Learn various types of log sources and their ingestion in the SIEM
  • Understand the process behind alerting and alert analysis

Questions

What does SIEM stand for?

Nothing to explain here 🙂

Answer: Security Information and Event Management system


Task 2: Logs Everywhere, Answers Nowhere

In a network with various components (e.g., Linux/Windows endpoints, a data server, and a website), each device generates logs. These logs help detect activities and potential threats.

Types of Log Sources:

  1. Host-Centric Logs:
    • Capture events on individual devices (e.g., user login, file access, PowerShell execution).
    • Examples: Windows Event Logs, Sysmon, Osquery.
  2. Network-Centric Logs:
    • Capture communication between devices or with the internet (e.g., SSH sessions, web traffic, VPN access).

Answers Nowhere – Challenges

  • Numerous Log Sources: Hundreds of events per second across many devices.
  • No Centralization: Logs remain on individual machines, requiring manual access (SSH, RDP).
  • Limited Context: Single logs may look harmless, but correlation reveals malicious patterns (e.g., lateral movement).
  • Limited Analysis: Human analysts cannot realistically process the massive volume of logs.
  • Format Issues: Logs differ in format across devices, making analysis complex.

Questions

Is Registry-related activity host-centric or network-centric?

Registry information is related to an endpoint, therefore it is host-centric.

Answer: host-centric

Is VPN related activity host-centric or network-centric?

VPN information is all about communication over a network, therefore we are talking about network-centric information here.

Answer: network-centric


Task 3: Why SIEM?

Key Features of SIEM

  • Centralized Log Collection
    • Collects logs from endpoints, servers, firewalls, etc.
    • Centralizes them in one place via agents or APIs.
    • Eliminates the need to manually access each machine.
  • Normalization of Logs
    • Raw logs differ in format (Windows vs Linux).
    • SIEM parses logs into fields and normalizes them into a consistent format.
    • Simplifies analysis across diverse sources.
  • Correlation of Logs
    • Links related events across multiple sources.
    • Helps detect malicious patterns (e.g., VPN login → file access → PowerShell execution → outbound connection).
    • Provides context that individual logs cannot.
  • Real-time Alerting
    • Uses built-in and custom detection rules.
    • Triggers alerts when suspicious activity matches rule conditions.
    • Notifies analysts for immediate investigation.
  • Dashboards and Reporting
    • Visualizes normalized data into actionable insights.
    • Includes default and customizable dashboards.
    • Displays metrics such as:
      • Alert highlights
      • System notifications
      • Health alerts
      • Failed login attempts
      • Events ingested count
      • Rules triggered
      • Top domains visited
  • Additional Features
    • Threat intelligence integration
    • Long-term data retention
    • Advanced search capabilities
    • Other enhancements for mature security operations

Questions

Read the task above.

Answer: No answer needed


Task 4: Log Sources and Log Ingestion

Every device on a network generates logs when activities occur—like website visits, SSH connections, or logins. These logs are essential for monitoring and detecting potential security threats.

Common Devices and Their Logs:

  • Windows Machines:
    • Uses Event Viewer to store and view logs.
    • Each event has a unique ID.
    • Logs are forwarded to the SIEM for visibility and analysis.
  • Linux Workstations:
    • Logs are stored in specific files, such as:
      • /var/log/httpd: Web requests/responses and errors
      • /var/log/cron: Cron job events
      • /var/log/auth.log or /var/log/secure: Authentication logs
      • /var/log/kern: Kernel-related events
  • Web Servers:
    • Monitor incoming/outgoing traffic for attacks.
    • Apache logs typically found in /var/log/apache or /var/log/httpd.

Log Ingestion into SIEM

To analyze and monitor logs effectively, SIEM tools collect them using different ingestion methods:

  1. Agent/Forwarder:
    Lightweight tool installed on endpoints to send logs to SIEM (e.g., Splunk Forwarder).
  2. Syslog:
    Protocol used to send real-time logs from devices like servers and firewalls to SIEM.
  3. Manual Upload:
    Some SIEMs support uploading offline data for analysis (e.g., Splunk, ELK).
  4. Port Forwarding:
    SIEM listens on a port where devices send their log data.

Questions

In which location within a Linux environment are HTTP logs stored?

HTTP logs are stored at /var/log/httpd.

Answer: /var/log/httpd


Task 5: Alerting Process and Analysis

Correlation Rules

Correlation rules are logical expressions set by analysts to detect threats.

Examples of Correlation Rules:

  • 5 failed logins in 10 seconds → Multiple Failed Logins Alert
  • Successful login after failed attempts → Brute Force Alert
  • USB plugged in → USB Access Alert
  • Outbound traffic > 25 MB → Potential Data Exfiltration

Use Case 1: Log Deletion

  • Event ID: 104 (Windows)
  • Rule: If Log source is WinEventLog AND EventID is 104 → Trigger "Event Log Cleared"

Use Case 2: Suspicious Command Execution

  • Event ID: 4688 (Process Execution)
  • Rule: If Log Source is WinEventLog AND EventCode is 4688 AND NewProcessName contains "whoami" → Trigger "WHOAMI Command Detected"

Alert Investigation Workflow

SOC Analysts use dashboards to monitor and investigate alerts:

  1. Alert Triggered
    • Review associated events/flows
    • Check which rule condition was met
  2. Investigation Outcome:
    • False Positive → Tune the rule
    • True Positive
      • Deepen the investigation
      • Contact asset owner
      • Isolate affected host
      • Block suspicious IP

Questions

Which Event ID is generated when event logs are removed?

The event that gets trigged when event logs get deleted is event ID 104.

Answer: 104

What type of alert may require tuning?

False positives! In case of these we would like to do some tuning of our rules to avoid similar False positives from occurring again. False positives could end up swamping us!

Answer: False Positive


Task 6: Lab Work

Click on the View Site button below, which will display the lab on the right side of the screen.View Site

In the static lab attached, a sample dashboard and events are displayed. When a suspicious activity happens, an Alert is triggered, which means some events match the condition of some rule already configured. Complete the lab and answer the following questions.

Questions

After clicking on the Start Suspicious Activity button, which process caused the alert?

View the static site. Start by pressing the Start Suspicious Activity button.

Dashboard
Dashboard

A process will start blinking in red:

Cudominer.exe
Cudominer.exe

The process is called cudominer.exe.

Answer: cudominer.exe

Find the event that caused the alert, which user was responsible for the process execution?

Click the process, and you will enter a event log. We now need to find the user which was responsible for executing the cudominer process.

On the fourth row you will see the cudominer process. There is also a UserName column, and in it you will see that the user who executed the process is Chris. Look at the last row:
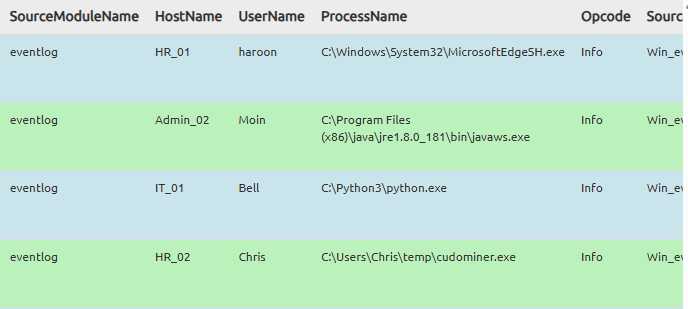
Answer: Chris

What is the hostname of the suspect user?

Next to the UserName is the HostName. The user’s hostname is HR_02.

Answer: HR_02

Examine the rule and the suspicious process; which term matched the rule that caused the alert?

Click the event row, and now you get shown the Rule that triggered the event.

Event Rule
Event Rule

You can see that the rule checks is the process name includes miner or crypt. In this case, with the process called cudominer, the term that matched the rule is miner.

Answer: miner

Which option best represents the event? Choose from the following: – False-Positive OR – True-Positive

Press the Go to Analysis / Action button and you get presented with an action window. We need to confirm if the rule is a true-positive or false-positive.

Rule action
Rule action

The process is definitely sounds like some kind of crypto mining process, so let’s mark it as a true positive.

Answer: True-Positive

Selecting the right ACTION will display the FLAG. What is the FLAG?

We get shown a flag, YAY!

Answer: THM{000_SIEM_INTRO}


Task 7: Conclusion

In this room, we have covered what SIEM is, its capabilities, and what visibility it provides. Explore the following rooms and challenges to learn in-depth about how Incidents are investigated.

Questions

Complete this room

Answer: No answer needed.

Congratulations on completing Introduction to SIEM!!!

Congratulations on completing Introduction to SIEM

Congratulations on completing Introduction to SIEM. This room was a great, but very basic, introduction to SIEM. Let’s keep on moving!

Come back soon for more walkthroughs of rooms on TryHackMe and HackTheBox, and other Cybersecurity discussions.

Find my other walkthroughs here.

Like my articles?

You are welcome to comment on this post, or share my post with friends.I would be even more grateful if you support me by buying me a cup of coffee:

Buy me a coffee
Buy me a coffee

I learned a lot through HackTheBox’s Academy. If you want to sign up, you can get extra cubes, and support me in the process, if you use the following link:

https://referral.hackthebox.com/mzwwXlg

Newsletter Updates

Enter your email address below and subscribe to our newsletter

One comment

Leave a Reply

Your email address will not be published. Required fields are marked *