Jasper Alblas
Jasper Alblas
Mastering Data & Cybersec
Welcome to this walkthrough of the TShark: CLI Wireshark Features Room on TryHackMe. Now that the know the basics of TShark, we take our TShark skills to the next level by implementing Wireshark functionalities in the CLI.

Room URL:
https://tryhackme.com/room/tsharkcliwiresharkfeatures
I am making these walkthroughs to keep myself motivated to learn cyber security, and ensure that I remember the knowledge gained by these challenges on HTB and THM. Join me on learning cyber security. I will try and explain concepts as I go, to differentiate myself from other walkthroughs.
In our first room, TShark: The Basics, we covered the fundamentals of TShark by focusing on how it operates and how to use it to investigate traffic captures. In this room, we will cover advanced features of TShark by focusing on translating Wireshark GUI features to the TShark CLI and investigate events of interest.
The task files for this room are located in the following directory:
~/Desktop/exercise-filesAnswer: No answer needed
TShark, the command-line version of Wireshark, shares display filters with Wireshark and supports various statistical features. Key points include:
--color): Highlights packets for easier analysis.-z): Provides detailed insights into packet data, with various sub-options.-z io,phs -q): Displays a hierarchical view of protocols and packet distribution.-z plen,tree -q): Shows packet size distribution for anomaly detection.-z endpoints,ip -q): Lists unique IP endpoints and associated packet counts.-z conv,ip -q): Shows traffic flow between two IPs.-z expert -q): Provides automatic Wireshark-generated analysis, including retransmissions and HTTP requests.These features help analysts perform in-depth packet analysis efficiently through the command line.
The byte value of the TCP protocol is found by checking out the Protocol Hierarchy of the pcap file. We do this by running the following command:
tshark -r write-demo.pcap -z io,phs -q
As you can see, the answer is 62.
Answer: 62
The packet lengths tree view helps analysts to overview the general distribution of packets by size in a tree view. We can view the packet length tree by running:
tshark -r write-demo.pcap -z plen,tree -qThis shows the following:

The packet is in the 40-79 packet lengths row.
Answer: 40-79
To view the expert info summary we can run the following command:
tshark -r write-demo.pcap -z expert -q
The expert summary is mentioned in the fourth column.
Answer: Connection establish request (SYN): server port 80
We can list the communications with the following command:
tshark -r demo.pcapng -z conv,ip -qNote that we use a different file this time. Anyway, the output is as follows:

We can see that the IP address ending with 237 exists in all conversations.
Answer: 145[.]254[.]160[.]237[.]
Time to cover more statistics commands, this time protocol specific:
IPv4 & IPv6 Statistics: Use -z ptype,tree -q to view protocol distribution. IP hosts can be listed with -z ip_hosts,tree -q, and source/destination filtering is available via -z ip_srcdst,tree -q.
Traffic Analysis: Outgoing traffic (services/ports) can be filtered using -z dests,tree -q.
DNS Statistics: Summarize DNS activity with -z dns,tree -q, including query counts and response codes.
HTTP Statistics: Analyze HTTP traffic with options like -z http,tree -q for packet counters, -z http_srv,tree -q for load distribution, and -z http_req,tree -q for request tracking.
We can list all IP hosts by using the following command:
tshark -r demo.pcapng -z ip_hosts,tree -qThis shows the following output:

There is one IP with a count of 7.
Answer: 216[.]239[.]59[.]99
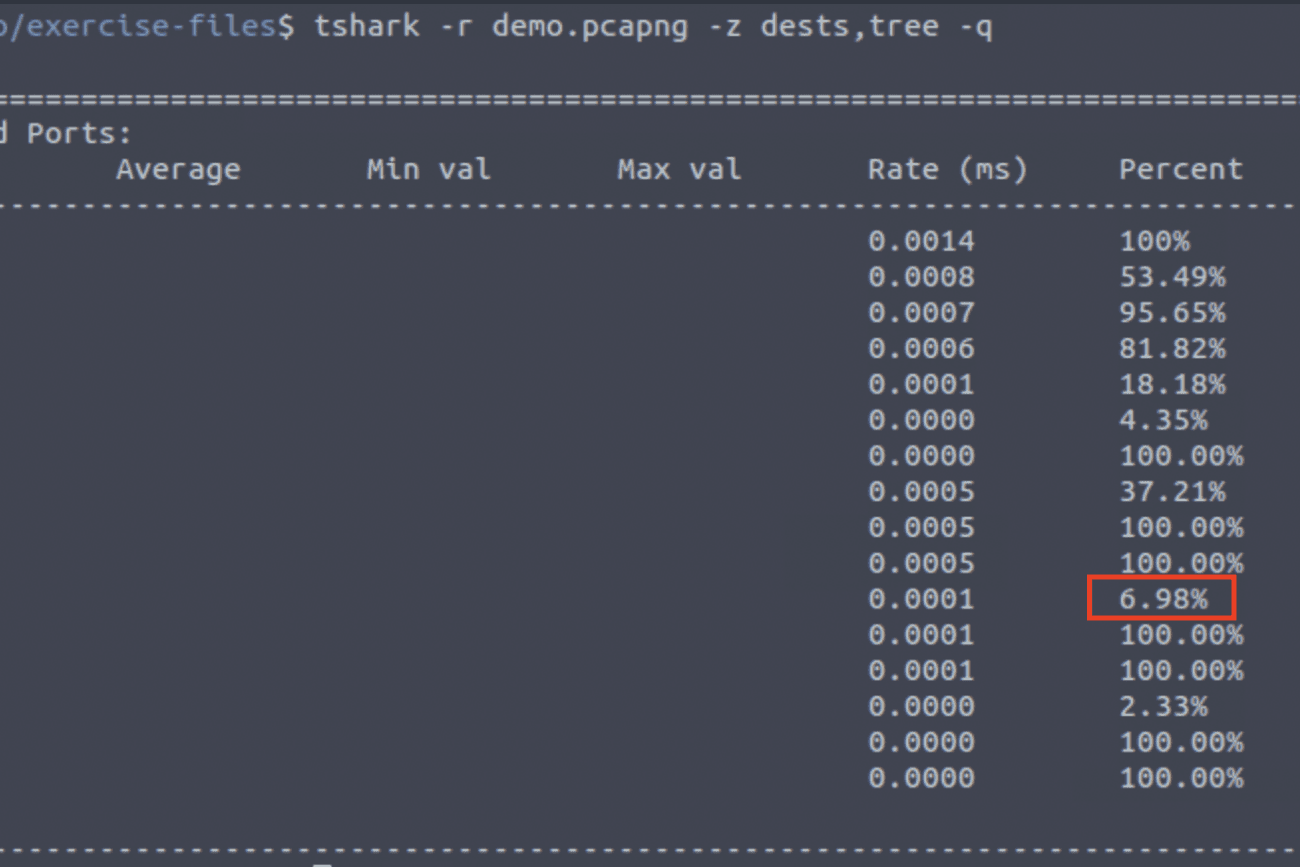
This time we have to look at the destination address only. We can find a similar overview as before, but this time focused on destination addresses, by running:
tshark -r demo.pcapng -z dests,tree -qLook up the previously found IP address and you will find the answer:

Answer: 6.98%
Just 3 lines underneath the previous answer, you will find the value 2.33%. This corrosponds to the IP 145[.]253[.]2[.]203.
Answer: 145[.]253[.]2[.]203
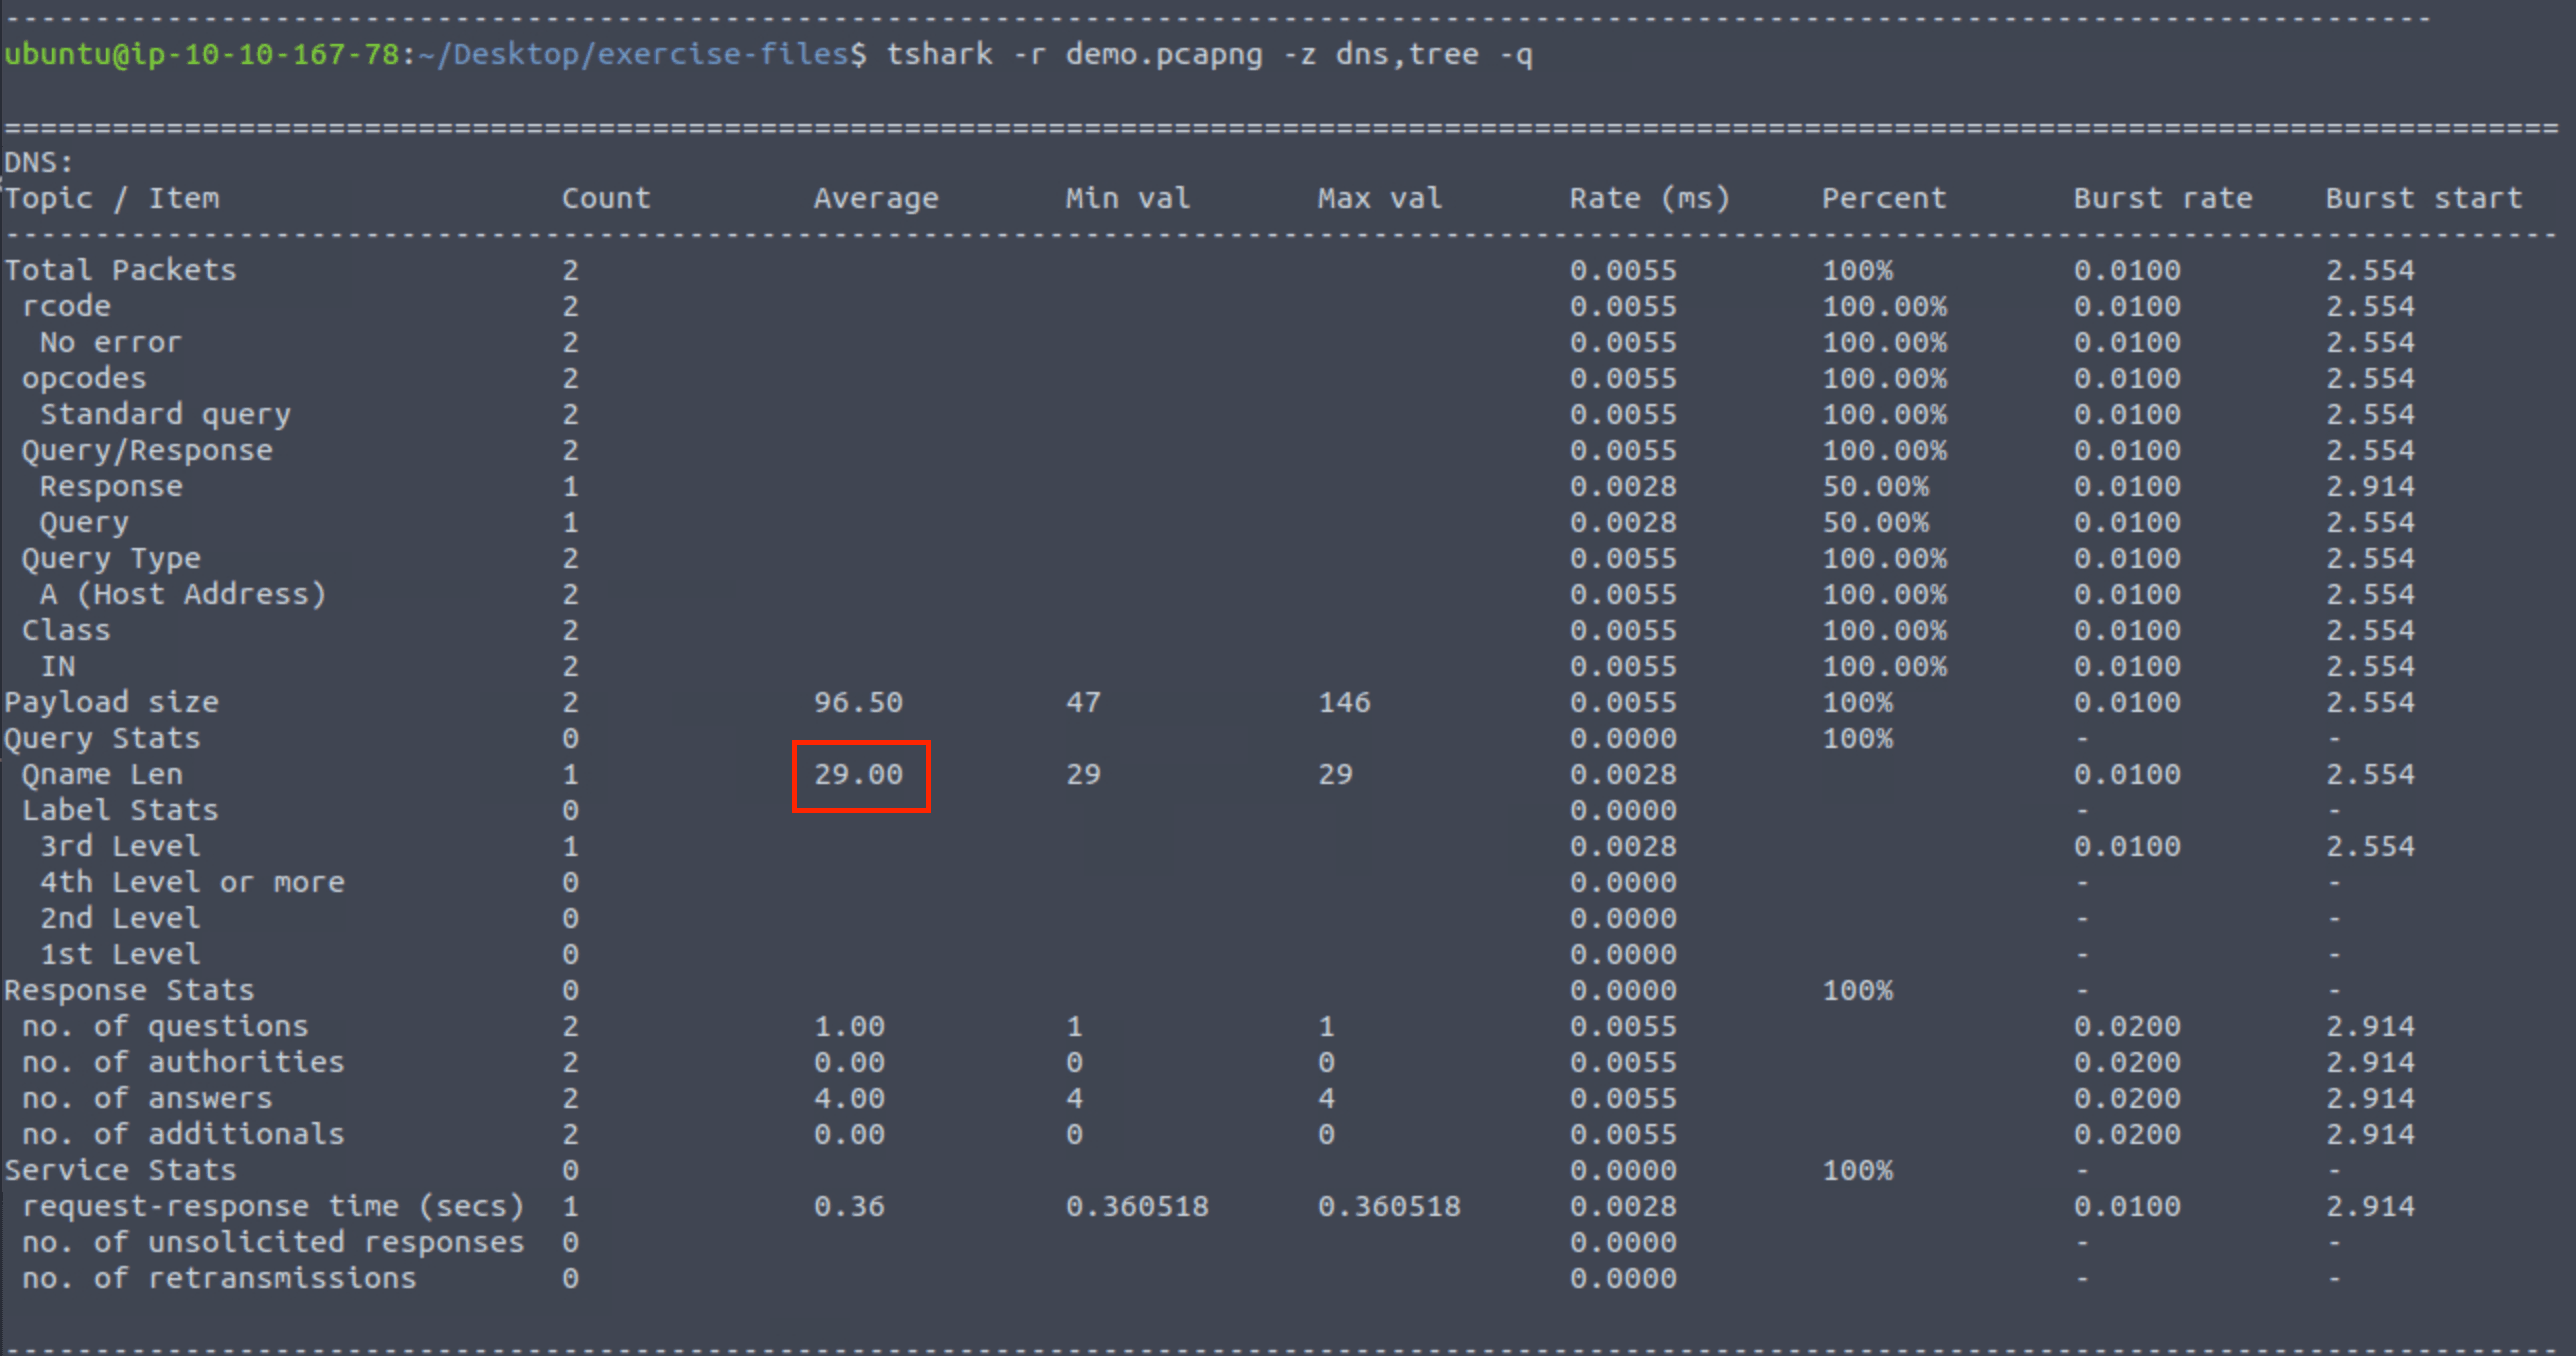
The Qname (Query Name Minimisation) is what you’re trying to resolve. If you’re resolving a typical A record, then the QNAME has traditionally been the fully qualified domain name (FQDN) of the host. Thus we need to look at the DNS protocol.
We do this by adding the dns statistics flag, in addition to tree:
tshark -r demo.pcapng -z dns,tree -q
You will find the Qname Len value as highlighted. The answer is 29.00.
Answer: 29.00
This task covers other TShark features, including following streams, exporting objects, and extracting credentials.
-z follow command, similar to Wireshark’s feature.tshark -r demo.pcapng -z follow,tcp,ascii,1 -q follows a TCP stream.--export-objects parameter.tshark -r demo.pcapng --export-objects http,/home/ubuntu/Desktop/extracted-by-tshark -q extracts files from HTTP traffic.-z credentials -q.tshark -r credentials.pcap -z credentials -q lists usernames found in FTP packets.Each feature helps network analysts inspect captured packets efficiently.
Ok, time to follow some streams. If you have read the theory you know we gotta run:
tshark -r demo.pcapng -z follow,udp,ascii,0Where udp stands for the protocol to follow, and the 0 is for the first stream (streams start at 0).
You will see a log UDP stream. In the bottom you will find the value for node 0.

Answer: 145[.]254[.]160[.]237:3009
This time we use a quite similar command:
tshark -r demo.pcapng -z follow,http,ascii,1You will find the referer and other headers in the middle:

You can defang the URL here:
Answer: hxxp[://]www[.]ethereal[.]com/download[.]html
The command to use is the one exactly as mentioned in the theory:
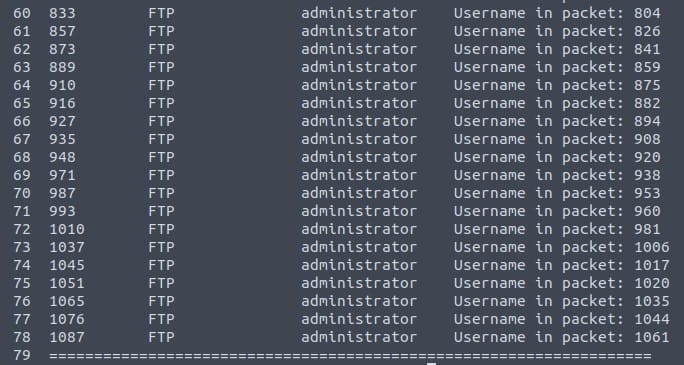
tshark -r credentials.pcap -z credentials -q | -nl
I added -nl to count the line numbers, to make it easier to count the total number of detected credentials.

Bear in mind, the total number is not 79, but 74 as there are 3 header lines we need to remove and a final line in the end.
Answer: 74
TShark provides advanced filtering options for in-depth packet analysis using the “contains” and “matches” operators, as well as field extraction.
http.server contains "Apache" (Find all HTTP packets where the server contains “Apache”).http.request.method matches "(GET|POST)" (Find all HTTP packets where the request method is GET or POST).tshark -r demo.pcapng -T fields -e <field name> -E header=ytshark -r demo.pcapng -T fields -e ip.src -e ip.dst -E header=y -c 5The question does not really mention in what kind of field we need to search for CAFE. But I adjusted the example from the theory, replaced the search word with CAFE, and sure enough this command worked:
shark -r demo.pcapng -Y 'http.server contains "CAFE"'
We found the word in packet number 27.
Answer: 27
It is time to use the MATCHES keyword, and in addition extract the correct field. According to the hint we need to extract the frame.time field, and we can add this extraction with the -T flag after the MATCHES example from the covered theory. This brings us the following command:
tshark -r demo.pcapng -Y 'http.request.method matches "(GET|POST)"' -T fields -e frame.time
The first time value found is May 13, 2004 10:17:08.222534000 UTC.
Answer: May 13, 2004 10:17:08.222534000 UTC
Security analysts should extract hostnames, DNS queries, and user agents when investigating a case. These techniques help identify suspicious activity and prioritize threats.
tshark -r hostnames.pcapng -T fields -e dhcp.option.hostnametshark -r hostnames.pcapng -T fields -e dhcp.option.hostname | awk NF | sort -r | uniq -c | sort -rawk NF: Removes empty linessort -r: Sorts data in reverse orderuniq -c: Counts occurrences of unique valuestshark -r dns-queries.pcap -T fields -e dns.qry.name | awk NF | sort -r | uniq -c | sort -rtshark -r user-agents.pcap -T fields -e http.user_agent | awk NF | sort -r | uniq -c | sort -rsqlmap, Nmap Scripting Engine) used for scanning or attacks.We can find all the unique hostnames with the following command:
tshark -r hostnames.pcapng -T fields -e dhcp.option.hostname | awk NF | sort -r | uniq -c | sort -r This shows the following list:

You can go ahead and count them, or pipe a wc -l command behind the rest to count the number of lines for you:
tshark -r hostnames.pcapng -T fields -e dhcp.option.hostname | awk NF | sort -r | uniq -c | wc -lThe answer is 30.
Answer: 30
See the fourth most common hostname on the previous screenshot. prus-pc appears 12 times.
Answer: 12
To find the most common DNS queries we can use the command discussed in the theory:
tshark -r dns-queries.pcap -T fields -e dns.qry.name | awk NF | sort -r | uniq -c | sort -rHere we find the query names, remove empty lines, sort and remove duplicates.

The most common DNS query is db.rhodes.edu, and it has a total of 472 queries.
Answer: 472
Let’s run the command mentioned in the theory:
tshark -r user-agents.pcap -T fields -e http.user_agent | awk NF | sort -r | uniq -c | sort -r
We see two Wfuzz entries. The first one occurs 9 times and the second one 3 times. This makes 12.
Answer: 12
We can see the Nmap Scripting Engine in the output above, but we can’t see the hostname. Therefore we need to enhance the previous command with the http.host field to answer this question:
tshark -r user-agents.pcap -T fields -e http.user_agent -e http.host | awk NF | sort -r | uniq -c | sort -r
Now we can see the relevant hostname, which is 172[.]16[.]172[.]129.
Answer: 172[.]16[.]172[.]129.
Congratulations! You just finished the TShark: CLI Wireshark Features room. In this room, we covered how to implement Wireshark GUI’s features into the TShark CLI, advanced filtering options, and use case examples.
Now, we invite you to complete the TShark challenge rooms:
Answer: No answer needed.

Congratulations on completing TShark: CLI Wireshark Features. This room learned me how powerful TShark can be when using command-line ninja skills. I hope you learned a lot as well!
Come back soon for more walkthroughs of rooms on TryHackMe and HackTheBox, and other Cybersecurity discussions.
Find more of my walkthroughs here.
You are welcome to comment on this post, or share my post with friends.I would be even more grateful if you support me by buying me a cup of coffee:

I learned a lot through HackTheBox’s Academy. If you want to sign up, you can get extra cubes, and support me in the process, if you use the following link: